
Member Features
Find Real Estate Bargain!
Full foreclosure details
Home value, equity and ownership info
Find homes priced below market
Get full access with a FREE Account
Already a member?
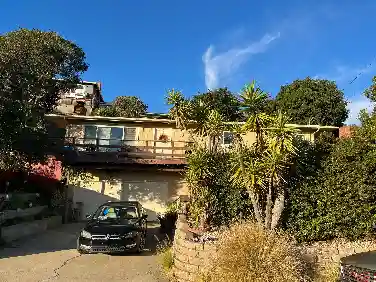
$1,291,000
Est. Value2beds
2baths
2,245sqft
5,809sqft lot
916 Portola Dr, Del Rey Oaks, CA 93940
Member Features
Find Real Estate Bargain!
Full foreclosure details
Home value, equity and ownership info
Find homes priced below market
Get full access with a FREE Account
Already a member?
Off Market
Home type
Price / sqft
Year built
Home Details
Interior Details
2245
2
2
Has Heating:
No
Heating Type:
None
Has Cooling:
No
Cooling Type:
N/A
Has Fuel:
No
Fuel Type:
N/A
Has Basement:
No
Basement Type:
No Basement
Has Flooring:
No
Flooring Type:
N/A
Has Fireplace:
Yes
Fireplace Type:
Yes
Property Details
5809
No
No
Type:
Garage, Attached
Location:
N/A
Status:
N/A
Number of Spaces:
1
N/A
N/A
N/A
N/A
N/A
N/A
N/A
Construction Details
Other
N/A
N/A
N/A
N/A
Tax History
Year
Amount
Land
Improvement
Percent Change
Assessment
2020
$7,605
$350,000
$360,000
--%
$710,000
2019
$1,141
$18,991
$69,110
--%
$88,101
2018
$1,024
$18,619
$67,755
--%
$86,374
2017
$956
$18,254
$66,427
--%
$84,681
2016
$939
$17,897
$65,125
--%
$83,022
2014
$911
$17,284
$62,891
--%
$80,175
2013
$891
$17,206
$62,607
--%
$79,813
2012
$772
$16,869
$61,380
--%
$78,249
Average Home Price in 93940
Nearby Properties
Zip Code
Price
Bed
Bath
Sqft
Lot
Sold Date
$1,096,000
$1,096,000
3 Beds
2 Baths
1,935 Sqft
7,462 Lot (sqft)
Sold 12/04/2023
$1,416,000
$1,416,000
3 Beds
2 Baths
2,278 Sqft
9,500 Lot (sqft)
Sold 12/04/2023
$952,000
$952,000
3 Beds
2 Baths
2,421 Sqft
9,600 Lot (sqft)
Sold 11/20/2023
$1,201,000
$1,201,000
4 Beds
2 Baths
2,048 Sqft
5,649 Lot (sqft)
Sold NaN/NaN/NaN
Calculators
Mortgage
Mortgage Calculator
Details for 916 PORTOLA DR

Property Debt

Foreclosure Contact Details

Current Owner
Transaction History
Similar Homes Nearby
Guides for Portola Dr

This blog post discusses the dynamic real estate trends in Bakersfield, noting fluctuations in property values, sale prices, and activity levels. It also highlights differences in nearby cities, showcasing diverse market conditions shaped by localized factors and broader economic trends.


